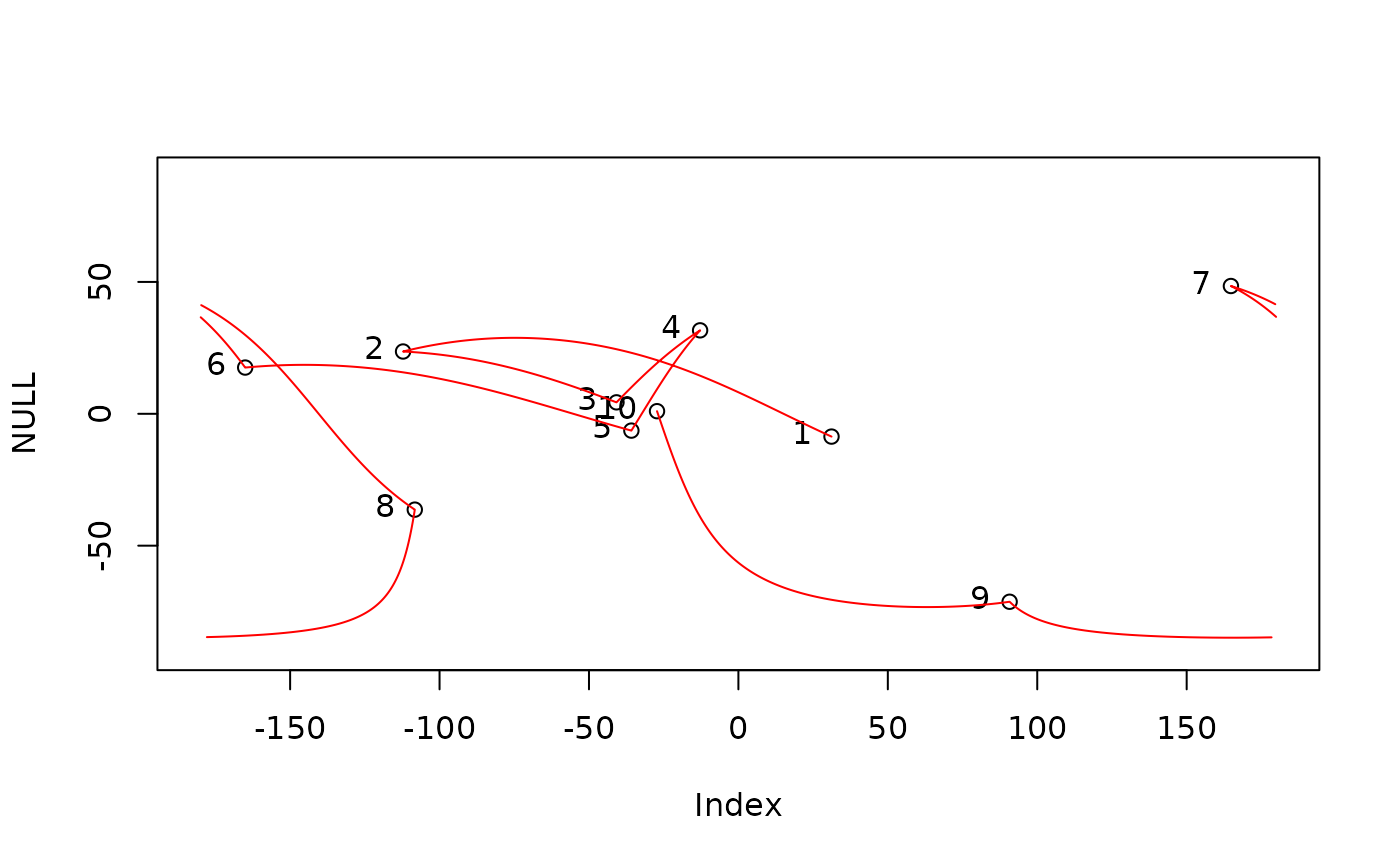
Low level plotting of great circle arcs with lines
Usage
arcs(x, ...)

# S4 method for class 'matrix'
arcs(x, breaks = 100, breakAtDateline = TRUE, plot = TRUE, ...)

# S4 method for class 'data.frame'
arcs(x, ...)
Arguments
- x
A matrix of longitude and latitude points (WGS 84 longlat)
- ...
Arguments passed to lines (par)
- breaks
the number of points inserted between every points to draw great circle arcs.
- breakAtDateline
Logical to indicate whether the lines are to be broken at the dateline.
- plot
Logical value whether the plotting should be done at all (in case returned values are needed).

