Patches of shapes on an icosahedral grid
Source:R/grid-graphs.R, R/data-facelayer-graphs.R
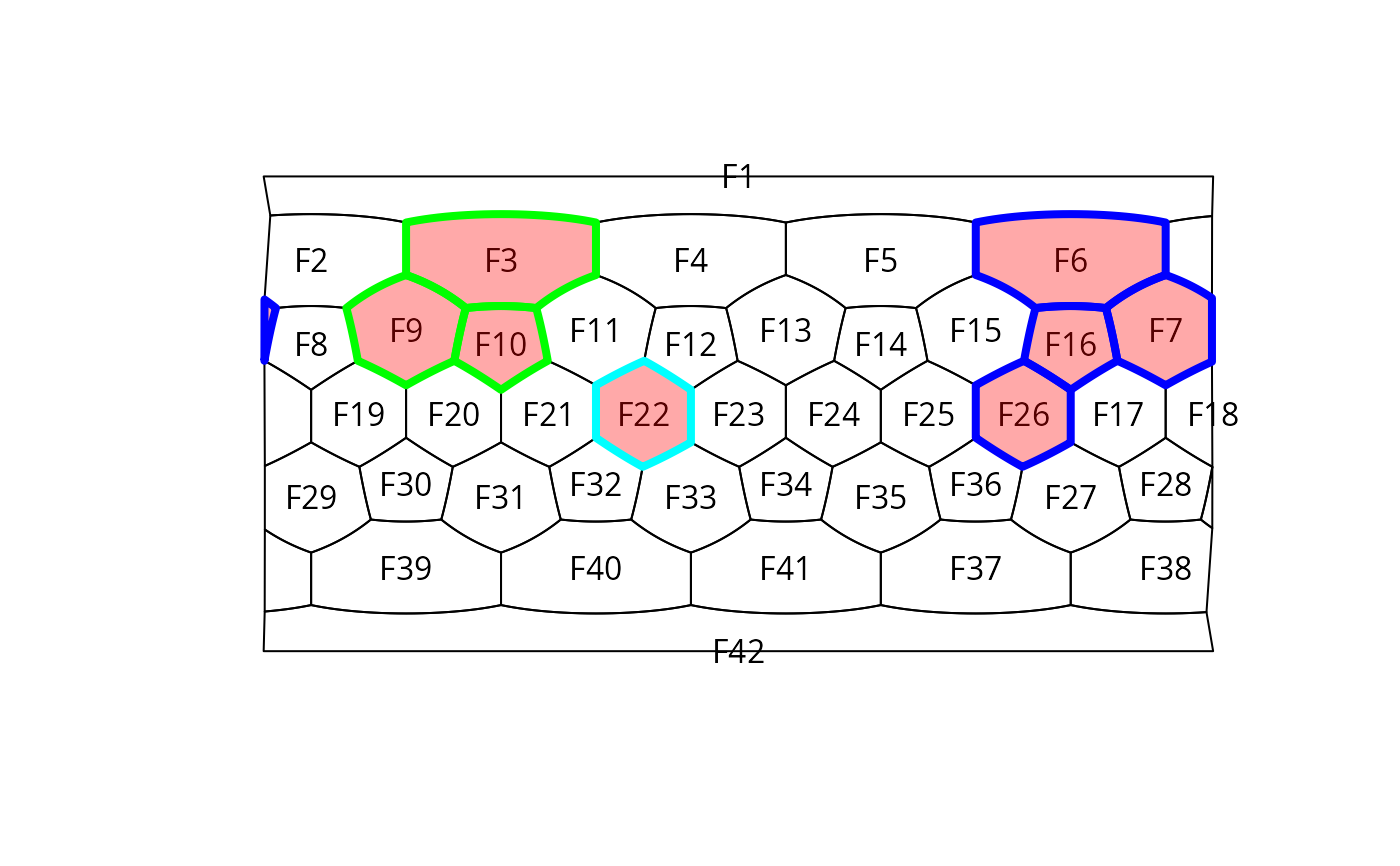
patches.RdThe function calculates the face names that represent patches in a surface shape
Usage
# S4 method for class 'trigrid'
patches(x, y, ...)

# S4 method for class 'facelayer'
patches(x)Details
The function uses the horizontal graph of a trigrid-class object, and searches for isolated subgraphs.
This function relies on the igraph package to run.
Examples
# create a grid
hex <- hexagrid(2, sf=TRUE)
# an example shape
shape <- paste0("F", c(3,6,7,9, 10, 16, 22, 26))

# visualize basic grid
plot(hex)
gridlabs(hex)

# visualize the shape
plot(hex, shape, col="#FF000055", add=TRUE)

# calculate holes
pa <- patches(x=hex, y=shape)

# plot all patches (coloring borders)
plot(hex, names(pa[pa==1]), add=TRUE, border="#00FF00", lwd=4)
plot(hex, names(pa[pa==2]), add=TRUE, border="#0000FF", lwd=4)
plot(hex, names(pa[pa==3]), add=TRUE, border="#00FFFF", lwd=4)